Browse categories
Explore
Fiverr Pro
English
$
USD


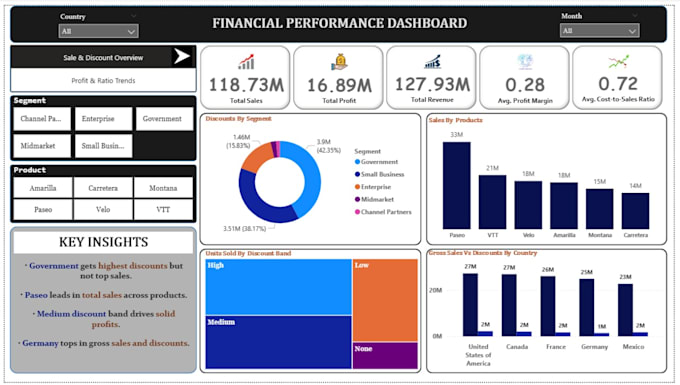
Stop drowning in spreadsheets and start making data-driven decisions. As a Commerce graduate specializing in Accounting and Finance, I offer more than just technical visualization-I provide strategic financial clarity.
Whether you are a startup or an established firm, I transform messy Excel, SQL, or CSV data into professional, interactive dashboards in Power BI and Excel. My approach combines technical precision with a deep understanding of financial literacy and the modern impact of AI on business operations.
What this gig delivers:
With a background in leading teams and a focus on operational excellence, I ensure every deliverable is accurate, high-quality, and aligned with your business goals.
Data Analyst, Content Writer, Project Manager
Languages