Browse categories
English
$
USD
Connect to your AI
Got a dataset but no idea what it is telling you? I will explore it and hand you clear charts and findings you can act on.
What you get:
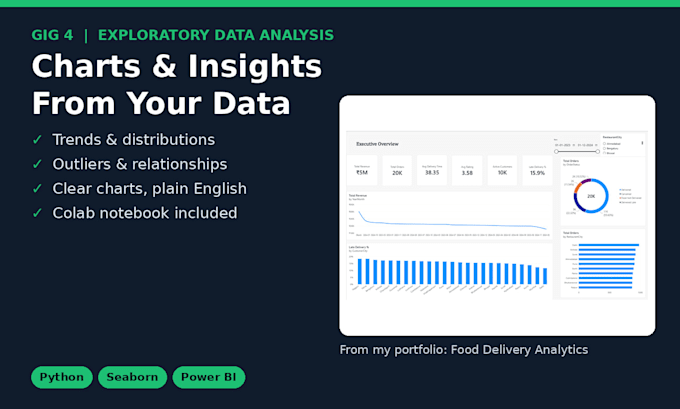
Distributions, trends and relationships between variables Outliers and unusual patterns Clean, labelled charts (Matplotlib and Seaborn) Written key insights in plain English, not jargon Suggested next steps for your business or model The Google Colab notebook, so you can rerun it
In my public project I produced 30 charts from 20K+ orders and found, for example, that demand peaks at lunch and dinner and that only about 56 percent of orders were delivered cleanly.
I also report honestly when the data does not support a conclusion.
Tools: Python (Pandas, Matplotlib, Seaborn), MySQL, Power BI.
Tell me your business question and share your data (CSV or Excel).
Expertise:
Business Insights
Technology:
Jupyter Notebook
•
Power BI
Programming language:
Python
•
SQL
Can you build a dashboard too?
Yes. The Premium package includes a 1-page Power BI overview. Larger dashboards need a custom offer.
Do you do predictions or machine learning?
Not in this gig. I can message you about a custom offer.
What if the data has no clear pattern?
I will say so plainly and explain what extra data would help.
