Browse categories
Explore
Fiverr Pro
English
$
USD


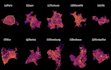

I create simple and beautiful charts using Python, including bar charts, pie charts, line charts, scatter plots, histograms, box plots, heatmaps, and other basic data visualizations. Clean style, attractive colors, and suitable for research, reports, and presentations.
Please inform the freelancer of any preferences or concerns regarding the use of AI tools in the completion and/or delivery of your order.
Environmental Data Scientist
Languages
| (1) | ||
| (0) | ||
| (0) | ||
| (0) | ||
| (0) |
sundamey

United States
Fantastic work! I had a set of Python-generated graphs where the text labels were overlapping, and I needed them fixed without altering the underlying data or styling. The freelancer understood the requirements perfectly, applied the spacing adjustments precisely, and delivered high-quality, clean results...
Up to $50
Price
9 days
Duration
| (1) | ||
| (0) | ||
| (0) | ||
| (0) | ||
| (0) |
sundamey
United States
Fantastic work! I had a set of Python-generated graphs where the text labels were overlapping, and I needed them fixed without altering the underlying data or styling. The freelancer understood the requirements perfectly, applied the spacing adjustments precisely, and delivered high-quality, clean results...
Up to $50
Price
9 days
Duration


