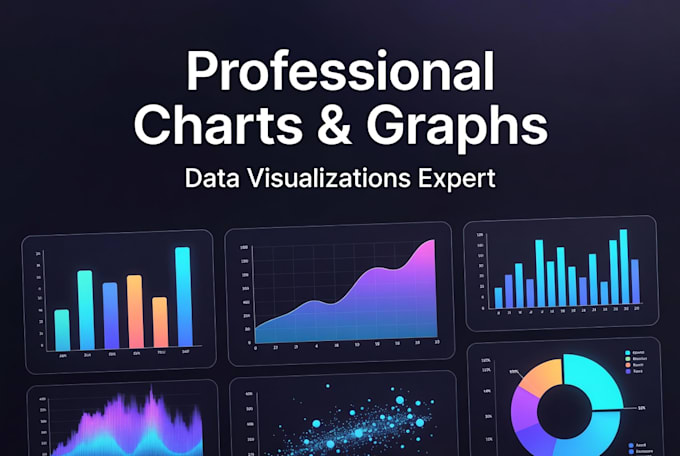
Transform your raw data into stunning, professional charts, graphs, plots & data visualizations that tell a clear story!
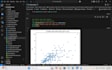
Need eye-catching bar charts, line graphs, scatter plots, heatmaps, pie charts, or publication-ready scientific plots? I specialize in turning complex data into beautiful, easy-to-understand visuals using the latest tools and best design practices.
What You'll Get:
- Custom charts & graphs tailored to your brand or requirements
- Clean, modern, and publication/presentation quality designs
- Multiple formats: PNG, PDF, SVG, interactive HTML (Plotly)
- Source files (Python code, Excel, etc.) upon request
- Unlimited revisions until you're completely satisfied
Tools & Expertise:
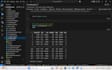
- Python (Matplotlib, Seaborn, Plotly, Pandas)
- R (ggplot2)
- Excel / Google Sheets
Perfect For:
- Business reports & presentations
- Academic papers, theses & research
- Marketing analytics & sales analytics
- Websites, blogs, and social media content
- Scientific publications & technical documents
Why Choose This Gig?
- Fast turnaround with clear communication
- Data-driven design that avoids misleading visuals
- 100% satisfaction guarantee
- Experience with large and comple