Browse categories
Explore
Fiverr Pro
English
$
USD



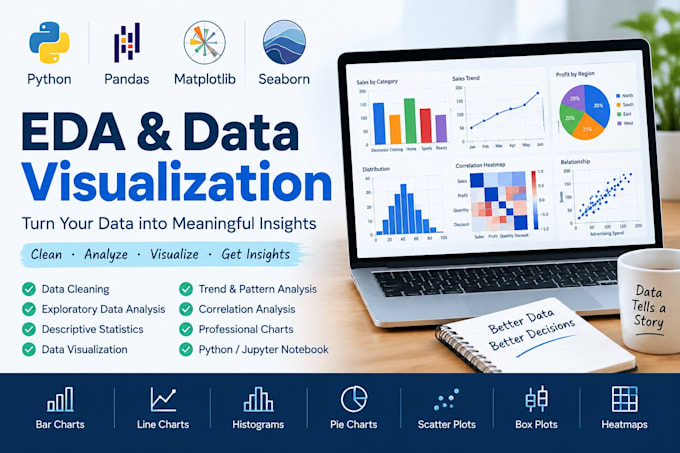
I will perform Exploratory Data Analysis (EDA) on your CSV or Excel dataset and create clear, easy-to-understand visualizations using Python, Pandas, Matplotlib, Seaborn, and Jupyter Notebook.
My services include:
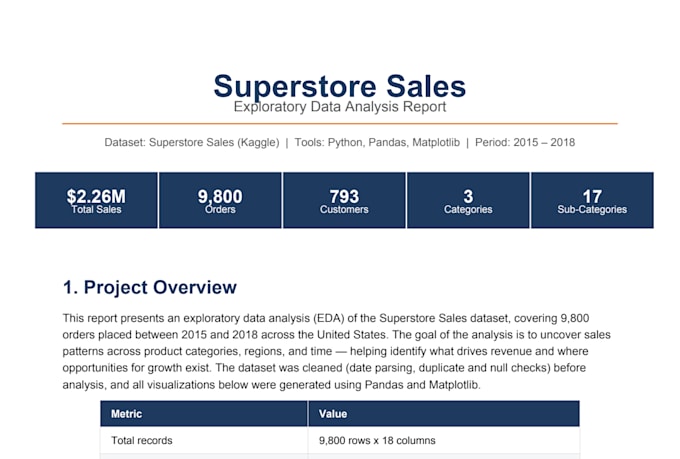
You will receive:
Clean and organized data
EDA results
Clear visualizations
Important insights from your data
Python/Jupyter Notebook depending on your package
I can work with CSV, Excel, and other commonly used tabular datasets.
Please contact me before ordering if your dataset is large or requires a specific analysis.
Aspiring Engineering Professional
Languages
Which tools do you use for data analysis?
I use Python, Pandas, Matplotlib, Seaborn, and Jupyter Notebook.
Can you create different types of charts?
Yes. I can create bar charts, line charts, histograms, pie charts, scatter plots, box plots, heatmaps, and other suitable visualizations.
Can you clean my dataset before analysis?
Yes. I can handle common data-cleaning tasks such as missing values, duplicates, and basic data formatting.