Browse categories
English
$
USD
Connect to your AI





Need a custom Streamlit dashboard for your business data? I build interactive dashboards in Python from your CSV or Excel file, so you can explore your numbers in the browser with KPI cards, charts and filters.
Good for sales, bookings, inventory, marketing or any other tabular business data.
WHAT YOU GET
KPI cards for your key numbers
Interactive Plotly charts that update with your filters
Sidebar filters, such as date, category or region
Auto-written key insights (Standard and Premium)
A clean, readable layout
Source code, requirements.txt and a README with simple run steps
WHAT I NEED FROM YOU
A CSV or Excel table (one row per record) and the questions you want the dashboard to answer. If your data is messy, choose Premium and I clean it first.
SEE MY WORK
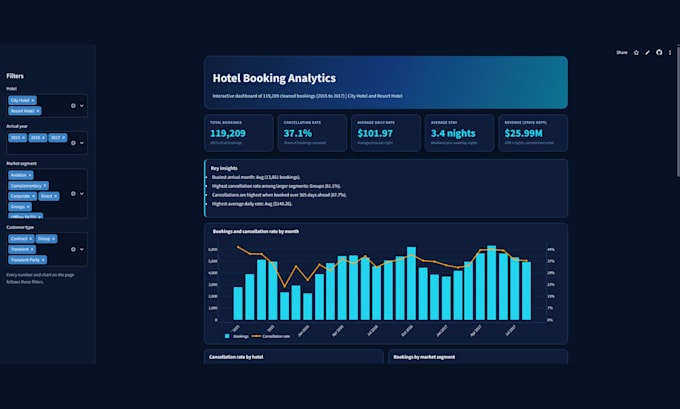
My hotel booking dashboard (public Kaggle data, self-practice project) has 119,209 bookings, 5 KPIs and 4 filters. See the gallery.
PRIVACY
Your data is never put on public hosting or a public repository. I deliver the app to run on your computer or on your own private setup.
Not sure what you need? Message me before ordering.
Excel and Streamlit Dashboards, Data Cleaning
Languages
Which tools do you use?
Python, Pandas, Plotly and Streamlit.
How do I run the dashboard?
I send the code, requirements.txt and a README with simple steps. The app runs in your browser on your computer.
Is my data kept private?
Your data is only used for your order and is never put on public hosting or a public repository. You can also anonymize sensitive columns before sending.
What if my data is messy?
Choose the Premium package. I clean the data first (up to 20,000 rows), then build the dashboard.