Browse categories
Explore
Fiverr Pro
English
$
USD


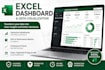
Need a clear and professional way to understand your data? I can help!
I will create a professional Excel dashboard that transforms your data into clear, useful, and easy-to-understand visualizations.
What I can create:
I have professional experience working with commercial and financial data, developing dashboards and reports to monitor KPIs, sales performance, and business trends.
Tools: Microsoft Excel, PivotTables, Power Query, charts, and interactive features.
You can provide your Excel or CSV data, and I will turn it into a structured and professional dashboard.
Please contact me before ordering if your project has specific requirements or complex data.
Business Analyst, Functional Analyst, Process and Data Solutions
Languages
What types of data can you use for the dashboard?
I can work with Excel and CSV files containing sales, financial, operational, or other business data.
Can you create interactive dashboards?
Yes. Standard and Premium packages can include interactive filters and slicers.
Can you create dashboards from my existing Excel file?
Yes. I can use your existing Excel or CSV data to create a professional dashboard.
Can you create custom KPIs and charts?
Yes. I can create KPIs and charts based on your data and business requirements.
Can you clean my data before creating the dashboard?
Yes. Basic data cleaning can be included when needed. Complex cleaning may require an additional service.
Can you create a dashboard for a specific business need?
Yes. I can customize the dashboard layout, KPIs, charts, and filters according to your requirements.
