Browse categories
English
$
USD
Connect to your AI
statistics expert,shopify expert
Are you looking for accurate and professional data analysis to turn your raw data into meaningful insights?
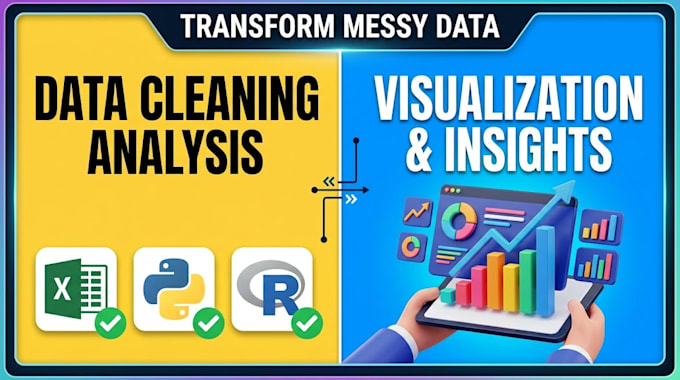
I will clean, analyze, and visualize your data using Excel, Python, and R. I can help transform messy datasets into clear, organized, and easy-to-understand results that support better decision-making.
What I can do:
️ Tools I use:
Excel | Python | R | Pandas | Matplotlib |SPSS
Why choose my service?
Accurate and well-organized analysis
Clean and professional visualizations
Easy-to-understand results
Attention to detail
On-time delivery
Clear communication
Whether you have a business dataset, survey data, research data, sales data, or any other dataset
What types of data can you analyze?
I can analyze business data, sales data, survey data, research data, financial data, and other structured datasets using Excel, Python, R, and SPSS.
Can you clean and preprocess my dataset?
Yes. I can clean your data, handle missing values and duplicates, correct formatting issues, and prepare the dataset for further analysis.
Do you provide statistical analysis?
Yes. I can perform descriptive statistics, correlation analysis, regression analysis, and other statistical analyses based on your dataset and requirements.
Can you perform regression analysis?
Yes. I can perform regression analysis to examine relationships between variables and provide clear results and interpretations.
Can you create charts and visualizations?
Yes. I can create clear and professional data visualizations using Excel, Python, R, Pandas, and Matplotlib.
Can you analyze data using SPSS?
Yes. I can perform statistical analysis in SPSS, including descriptive statistics, correlation, regression, and other analyses depending on your requirements.
Can you analyze survey or research data?
Yes. I can analyze survey and research datasets, summarize the results, identify patterns and relationships, and present the findings in an easy-to-understand format.
Can you create an Excel dashboard?
Yes. I can analyze your data in Excel and create organized tables, charts, summaries, and dashboards according to your requirements.
Will you provide an explanation of the results?
Yes. I can provide clear explanations and summaries of the analysis so that the results are easier to understand and interpret.
What do you need from me to start?
Please provide your dataset, analysis requirements or research questions, and any specific instructions you have. If you are unsure about the type of analysis needed, I can review the dataset and discuss suitable options with you.
