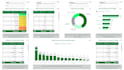
I will automate and analyze your financial data using python and excel
Transform Raw Data into Insights and Automated Solutions
About this Gig
Are you spending hours manually cleaning, analyzing, and reporting your financial data every month?
I can help you automate, analyze, and visualize your financial datasets using Python, Excel, and advanced analytics techniques
What I Can Do for You:
- Clean and structure messy financial data (Excel / CSV / Google Sheets)
- Automate recurring reporting tasks using Python scripts
- Create interactive dashboards for KPIs, revenue, expenses, profit margins, etc.
- Build financial forecasting models (sales projections, expense trends, etc.)
- Generate customized Excel reports with visualizations
- Perform ratio analysis, trend analysis, and break-even analysis
- Time series analysis and predictive modeling using Python
Tools & Technologies I Use:
- Python (Pandas, NumPy, Matplotlib, Seaborn, Plotly, Scikit-learn)
- Excel / Google Sheets
- Power BI (optional for dashboards)
- APIs & Web Automation (if needed for pulling data)
Why Choose Me:
- 100% automation of manual tasks more time for strategic work
- Clean, accurate, and structured financial outputs
- Custom solutions tailored to your business model
- Fast delivery and clear communication
- Bonus: Easy-to-follow documentation provided with each delivery
My Portfolio
FAQ
What kind of financial models can you build?
I can build a wide range of models including Discounted Cash Flow (DCF), Sensitivity & Scenario Analysis, 3-Statement Models (Income Statement, Balance Sheet, Cash Flow), Cost Volume Profit (CVP) Analysis, Monte Carlo Simulations, and more. I also offer custom models depending on your business needs
What formats do you deliver the work in?
I deliver models in Excel (editable format) and/or Python scripts (Jupyter Notebook or .py), depending on your preference. You can also request dashboards in Power BI