Browse categories
Explore
Fiverr Pro
English
$
USD

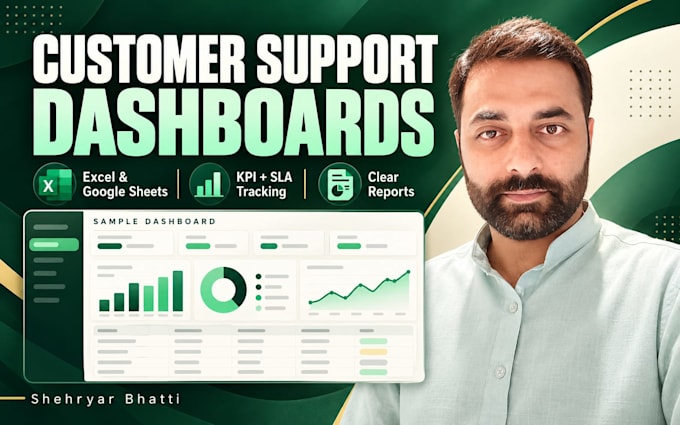

Turn your support data into a clear view of what needs attention.
I build practical Excel or Google Sheets dashboards from your exported records. My experience includes operational reporting, QA analysis, SLA monitoring and root cause analysis across metrics such as FRT, TRT and NPS.
BASIC: one clean export, up to 1000 rows, 3 KPIs and one dashboard.
STANDARD: one export, up to 5000 rows, 6 KPIs, basic cleanup and one view.
PREMIUM: up to two related exports, 10000 rows combined, 8 KPIs and two views.
Depending on your fields, track ticket volume, response/resolution time, SLA attainment, workload and trends. We agree on metric definitions first; missing data is flagged.
Delivery includes your workbook and a written refresh guide. Basic includes 1 revision; Standard and Premium include 2, within the agreed scope.
CSV/XLSX exports, formulas, pivots and charts only. No APIs, live integrations, VBA, Apps Script or Power BI. Please message with an anonymized sample before ordering and confirm Excel or Google Sheets.
SAAS, CUSTOMER SUCCESS, QUALITY ASSURANCE, OPERATIONS, SALES
Languages
Can you calculate every KPI and connect live data?
Only metrics supported by the supplied fields can be calculated. For example, response time needs suitable timestamps. Live connections and APIs are not included; you receive a written guide for refreshing the supplied export.
What should I send, and what do revisions cover?
Send an anonymized CSV/XLSX sample, metric definitions, targets and preferred output format. Remove unnecessary names, emails and message content. Revisions refine the agreed workbook; new data sources or additional KPIs need a separate scope.
