Browse categories
Explore
Fiverr Pro
English
$
USD
AI and ML Engineer, Data Science, Deep Learning, Computer Vision
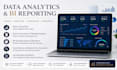
Turn your raw data into valuable business insights with professional Data Analysis, Business Intelligence (BI), and Data Visualization.
I'm an Artificial Intelligence student specializing in Data Analytics, Machine Learning, and Business Intelligence. I help businesses, researchers, startups, and students analyze data, identify trends, create interactive dashboards, and generate actionable insights using industry-standard tools.
Services I Offer:
Data Cleaning & Preprocessing
Exploratory Data Analysis (EDA)
Statistical Analysis
Data Visualization
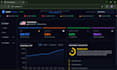
BI Dashboards & KPI Reports
SQL & Database Analysis
Trend & Time Series Analysis
Predictive Analytics
Executive Summary Reports
Python Automation
Source Code & Documentation
Tools: Python, Pandas, NumPy, Matplotlib, Plotly, SQL, Scikit-learn, Jupyter Notebook, Tableau & Power BI.
Why Choose Me?
Strong AI & Data Analytics foundation
Clean, well-documented code
Business-focused insights
Professional communication
Reliable, on-time delivery
Please contact me before ordering to discuss your dataset, objectives, and preferred deliverables. Together, we'll transform your data into clear, actionable insights.



Q: What file/data formats do you accept?
A: CSV, Excel, JSON, SQL, and NoSQL (MongoDB) databases.
Q: Do you only do analysis, or can you also clean and preprocess data for ML?
A: Yes — I handle full preprocessing (missing values, outliers, encoding, feature engineering) so your data is ready for Business and Trends , not just analyzed.
Q: Do you also clean and preprocess data?
A: Yes — full preprocessing including missing values, outliers, and encoding is part of the analysis process.
Q: How do you handle large or messy datasets?
A: I assess the dataset before starting — message me with a sample first so I can confirm scope and turnaround time.
Q: Do you use Power BI or Tableau?
A: I work with Tableau and Power BI for visualization and dashboards, alongside Python and SQL/NoSQL for the full analysis pipeline.


