I will analyze data and build dashboard using python and excel

India

I speak Hindi, English

Data Analyst

Data Analyst with hands-on experience designing end-to-end analytics pipelines, financial reporting dashboards, and SQL systems on datasets exceeding 1.7M records. Delivered AR ageing dashboards, DSO ...
About this Gig

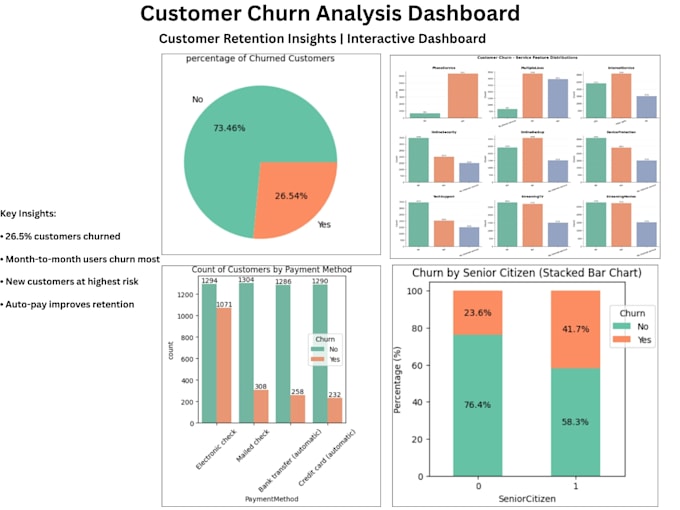
I will perform end-to-end data analysis and build interactive dashboards using Python and Excel.

Whether you are a business owner, student, or professional if you have raw data and need clear answers, I can help.

What I offer:

  • Data cleaning and preprocessing (missing values, duplicates, datatype fixes)
  • Exploratory Data Analysis (univariate and bivariate analysis)
  • Professional visualizations (bar charts, pie charts, histograms, stacked charts)
  • KPI dashboards and MIS reporting
  • Business insights summary and executive summary

Tools I use:

  • Python Pandas, NumPy, Matplotlib, Numpy
  • SQL MySQL, PostgreSQL (Window Functions, CTEs, Stored Procedures)
  • Excel Pivot Tables, Power Query, XLOOKUP, Dynamic Dashboards

Why work with me: Every deliverable is structured for clarity and business impact. No technical jargon just clean, actionable insights your team can actually use. My work follows Big 4 advisory style reporting standards.

Industries I can help with: Telecom, E-Commerce, Finance, Retail

Drop me a message before ordering I'll make sure I fully understand your data before we begin.

Analysis type:

Quantitative Analysis

Statistical Analysis

Expertise:

Business Insights

Trends

Probability

Statistics

Technology:

Excel

Google Analytics

Google Sheets

Jupyter Notebook

Programming language:

Python

SQL

My Portfolio

Other Data Analytics Services I Offer