Browse categories
Explore
Fiverr Pro
English
$
USD
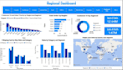
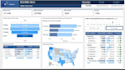
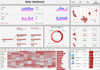
A Regional Sales Analysis Dashboard in BI provides a clear view of how sales performance varies across different geographic location such as countries, states or cities. It helps business understand whee revenue is being generated, which regions are performing well, and which area needs attention. The dashboard typically includes a map visualization to highlight sales distribution, along with bar and line charts to compare region-wise performance and track trends over time.Features like drill-down and interactive slicers allow users to explore data at a granular level, enabling deeper insights into specific regions. By analyzing metrics such as sales, profit, and target achievement, organizations can make informed decisions regarding resources allocation, market expansion and sales strategies.