Browse categories
Explore
Fiverr Pro
English
$
USD
Infra and Devops
I Will Set Up Grafana for Logging, Monitoring, and Alerts
Need real-time visibility into your app or server performance? I'll set up Grafana dashboards to monitor your infrastructure and log essential metrics so you can catch issues before your users do.
Hi, I'm Samarth, a DevOps and Cloud Engineer with hands-on experience setting up Grafana, Prometheus, and Loki for logging and monitoring live production systems.
What You'll Get:
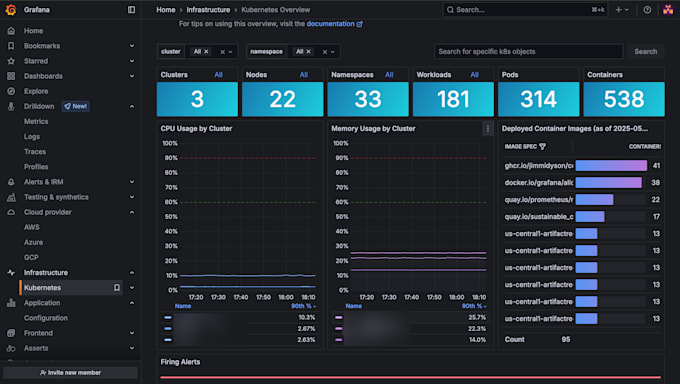
Custom Grafana Dashboards
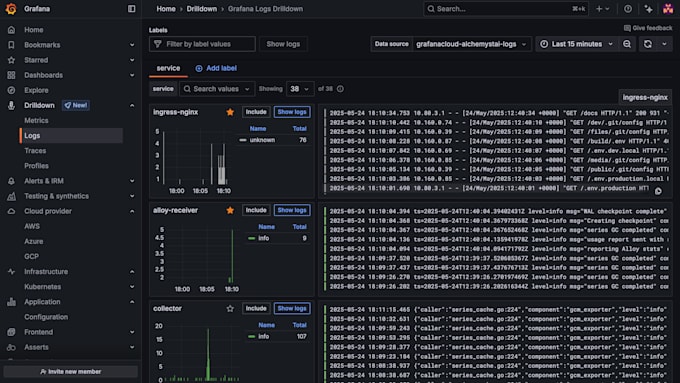
Integrated Logging (via Loki, Promtail, or other agents)
Real-Time Alerts
Secure Web Access
What do I need to get started with Grafana setup?
I’ll need access to your server (via SSH or cloud dashboard), your application stack details, and preferred tools (e.g., Docker, Kubernetes, Node Exporter, etc.). If unsure, I can help you decide.
Can you set up both metrics and logs in Grafana?
Yes. I set up Prometheus for collecting system and application metrics, and Loki/Promtail for centralized logging. You’ll get a unified dashboard with both logs and graphs.
Will I be able to monitor my app in real time?
Absolutely. Grafana dashboards auto-refresh and display real-time CPU, memory, disk usage, HTTP errors, and logs — perfect for catching issues as they happen.
What services or platforms do you support?
I support Docker, Kubernetes, standalone Linux servers, and cloud VMs from AWS, GCP, Azure, DigitalOcean, and more. I can adapt the stack to your setup.
Can you set up alerts when something goes wrong?
Yes! I’ll configure alerts that notify you via Slack, Email, Telegram, or Webhooks when thresholds are crossed — e.g., CPU > 90%, app crashes, or error spikes.
Is this suitable for production systems?
Yes, I follow best practices to ensure secure, scalable, and resource-efficient monitoring. It’s perfect for startups, indie projects, and full-scale production environments.
Will you provide instructions to use and maintain the setup?
Yes. You'll receive clear documentation on how to access your dashboards, modify alerts, add new panels, and troubleshoot if needed.