Browse categories
Explore
Fiverr Pro
English
$
USD


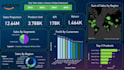
Sitting on spreadsheets and CSVs that should be telling you a story but aren't?
I build interactive dashboards and data analysis pipelines using Python, Streamlit, Plotly, and Power BI. You get clean, filterable, real-time visualizations not static screenshots. Upload your data, explore patterns, and make decisions faster.
What I deliver:
Popular use cases: Sales performance dashboards, marketing analytics, financial reporting, operations monitoring, HR analytics, e-commerce reporting, academic research visualization.
Why me? I combine data engineering and ML expertise I don't just plot charts, I clean, transform, and model your data first so the insights are actually accurate. Send me your dataset before ordering and I'll tell you exactly what's possible.
Build production ready solutions powered by AI
Languages
