Browse categories
Explore
Fiverr Pro
English
$
USD

Level 2
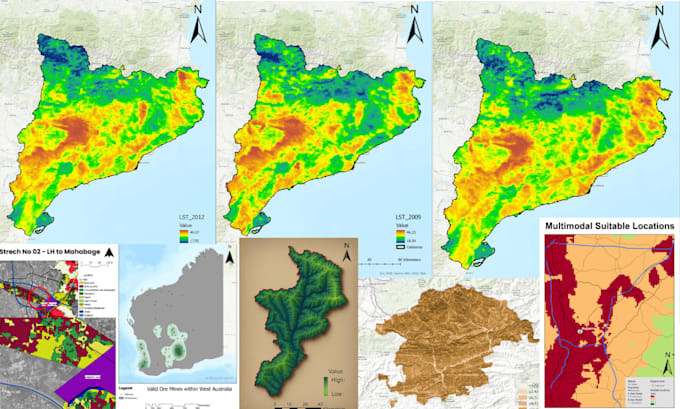
Im a GIS specialist with 7+ years of experience in spatial analysis, remote sensing, and professional GIS mapping.
I deliver solutions in QGIS, ArcGIS Pro, Google Earth Engine, Python, R, ENVI, and WebGIS. My expertise covers spatial analysis, geostatistics, and HQ cartographic visualizations for research or any gis related project.
Services I Provide
Why Me?
️ 100% Satisfaction Guaranteed
️ High-Quality Results
️ Global Project Experience
️ 24/7 Availability
Contact me Before placing an Order
Best Regards,
Samithsan
Client Satisfaction Guaranteed
Level 2
Languages
What types of GIS mapping services do you provide?
I offer customized GIS maps, land use analysis, hotspot mapping, remote sensing, and 3D mapping to provide actionable insights for your projects.
How can data visualization help my business?
Data visualization turns complex data into easy-to-understand visuals, helping you make informed decisions faster, whether for reports, presentations, or interactive dashboards.
What tools do you use for GIS and data visualization?
I use top industry tools like ArcGIS, QGIS, Power BI, Tableau, Flourish, and Google Data Studio to create high-quality maps and visuals tailored to your needs.
Can you create custom dashboards for my business?
Yes! I specialize in creating interactive, custom dashboards in Power BI, Tableau, or Google Data Studio, providing real-time insights into your data.
What is the turnaround time for a GIS mapping project?
Timelines vary based on complexity. Simple maps may take a few days, while more detailed analyses or custom dashboards could take a week or more. I’ll provide an estimate before we start.
How do I know if my data is ready for visualization?
If you're unsure, send me your data, and I'll review it to ensure it's ready for visualization. I can also clean and format your data for optimal presentation.
Do you offer revisions to the final deliverable?
Yes! I offer revisions to ensure you're fully satisfied with the final result. Your feedback is essential to me, and I’ll work until it meets your expectations.
What kind of support do you provide after delivery?
I provide post-delivery support for any adjustments or clarifications you may need. Ongoing support is available upon request.
How confident are you in delivering high-quality results?
With over 6 years of experience, I have successfully delivered hundreds of GIS and data visualization projects. Your project is in capable hands, and I focus on delivering the best quality and impact.
What information do I need to get started?
Simply provide your data and a description of your goals. We can discuss the specific details like design preferences, map features, or interactive elements to tailor the project to your needs.