Browse categories
Explore
Fiverr Pro
English
$
USD
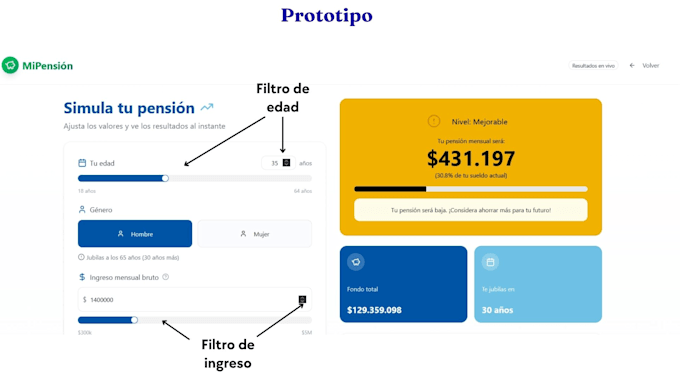
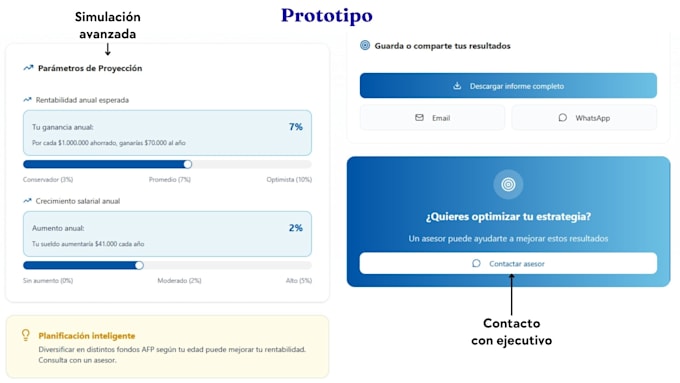
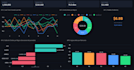
Do you need to visualize your data quickly, interactively, and professionally? I build custom data applications and dashboards using Streamlit and DuckDB.
I transform your raw files into powerful analytical tools. Depending on the scale of your project, I offer three tiers of service:
Why work with me?
Streamlit ensures a clean, intuitive user interface, while DuckDB's analytical engine guarantees ultra-fast data queries and transformations.
Please message me before placing an order to discuss your specific project requirements and ensure the best result.

Programming language:
Python
•
SQL
•
NoSQL
Analysis Type:
Quantitative Analysis
•
Predictive Analysis
Expertise:
Web analytics
•
Probability
Tools:
RStudio
•
Google Colab
What data formats do you accept?
CSV, JSON, Excel, and Parquet.
What if I need more than 2 pages?
The Premium package includes complex multi-page apps. Contact me for a custom offer if you need more.
Do I need tech skills to use it?
Not at all! The final apps are 100% user-friendly.