Browse categories
Explore
Fiverr Pro
English
$
USD


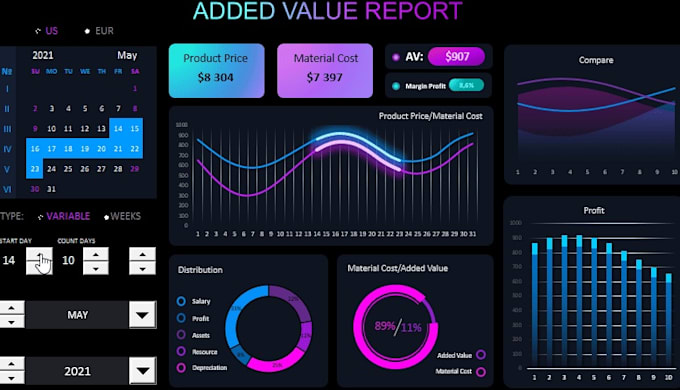
I will create fully customized Excel dashboards with interactive charts, KPI sheets, pivot tables, and automated reports tailored to your business needs.
Professional and visually appealing dashboard design
Let's turn your data into smart business insights. Message me before placing your order.
CLEAN EXCEL SPREADSHEET,EXCEL DATA ,DATA ENTRY ,SORTING, FILTERING
Languages
What is the primary purpose of this dashboard?
This dashboard is designed to provide a real-time (or near real-time) snapshot of [insert core metrics, e.g., Sales, Web Traffic, or Logistics]. It helps stakeholders make data-driven decisions by centralizing information from [Source A] and [Source B].
How often is the data updated?
Our data syncs every [e.g., hour / 24 hours at 2:00 AM EST]. You can check the "Last Refreshed" timestamp in the top right corner of the screen.
Can I filter the data for my specific region or department?
Yes. Use the Global Filters panel on the left (or top). You can filter by date range, region, product category, and more. Once applied, all charts on the page will update automatically.
How do I export this data for a presentation?
You can export individual charts or the entire report. For a single chart: Hover over the visual, click the three dots (options), and select "Export to CSV" or "Excel." For the whole page: Click the "Download" icon in the header to save as a PDF
Why does a chart look "blank" or show "No Data Found"?
This usually happens if the filters you’ve selected are too narrow (e.g., looking for a specific product in a region where it wasn't sold). Try resetting your filters to see if the data reappears.
What does [Metric Name, e.g., "Churn Rate"] actually mean?
We define [Metric Name] as: $$\text{Metric} = \frac{\text {Current Value} - \text{Previous Value}}{\text{Previous Value}} \times 100$$
The dashboard is loading very slowly. What should I do?
Large date ranges (e.g., "All Time") can slow performance. Try narrowing your filter to "Last 30 Days." If it persists, try clearing your browser cache or refreshing the page.