Browse categories
Explore
Fiverr Pro
English
$
USD
Full Stack Developer, Backend Engineer, Data Analyst, AI or ML Researcher
Want to turn your raw data into clear, actionable insights?
I perform end-to-end data analysis using Python cleaning,
exploring, modeling, and visualizing your data with interactive
charts and dashboards.
WHAT YOU GET
Data cleaning missing values, duplicates, formatting
Exploratory Data Analysis (EDA)
Trend, pattern & correlation analysis
Interactive charts & dashboards (Plotly)
RFM segmentation, CLV prediction, cohort analysis
Churn prediction (Scikit-learn, XGBoost)
PostgreSQL / SQL queries
Clean Jupyter Notebook + summary report
TECH STACK
Python: Pandas, NumPy, Matplotlib, Seaborn, Plotly
ML: Scikit-learn, XGBoost
DB: PostgreSQL, MySQL, MongoDB
Tools: Jupyter Notebook, Google Colab
PAST PROJECTS
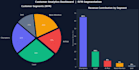
Customer Analytics Dashboard RFM segmentation,
CLV prediction, retention heatmaps (5,000+ records)
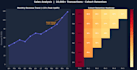
Sales Data Analysis 10,000+ transactions,
seasonal trends, 15% sales uplift identified
Message me BEFORE ordering share your dataset
and I'll confirm what's possible.

_chcaxk.jpg)

What file formats can you work with?
CSV, Excel (.xlsx), JSON, or direct database (PostgreSQL/MySQL). Share your data when ordering.
Is my data kept confidential?
Yes. I do not share or store your data. You can also share a sample/anonymized version.
What do I receive as the final deliverable?
A clean Jupyter Notebook (.ipynb), exported charts (PNG/HTML), and a written summary of findings.
Can you build a live dashboard?
Yes — an interactive Plotly-based HTML dashboard is included in Standard and Premium packages.


