Browse categories
Explore
Fiverr Pro
English
$
USD
Are you sitting on data but don't know what it's telling you?
I'm Siddharth, a data analyst specializing in turning raw, messy data into clear insights that help you make better business decisions.
What I will do for you:
Tools I use:
Industries I work with:
What you will receive:
I take time to understand your data before starting. Message me first let's discuss your project and make sure I'm the right fit
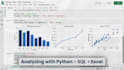
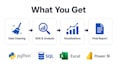
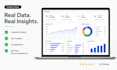
Q: What information do I need from you to get started?
A: Just share your dataset (Excel, CSV, or Google Sheets) and tell me what business question you want answered. The clearer your goal, the better the analysis.
Q: Will I be able to understand the report if I'm not technical?
A: Yes. I write all reports in plain business language with visual charts. No coding knowledge needed to read my deliverables.
Q: Can you work with large datasets?
A: Yes, I regularly work with datasets of 100,000+ rows using Python and SQL.


