Browse categories
Explore
Fiverr Pro
English
$
USD
GIS and Spatial Analysis Specialist, MSc Spatial Engineering
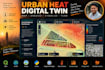
Cities absorb and hold heat differently block by block, and that pattern, known as the urban heat island effect, matters for public health, energy use, and climate planning. I map it using satellite thermal imagery and land surface temperature data, then turn the results into a digital twin of the area so you can see and share the pattern rather than just read about it.
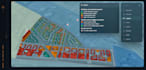
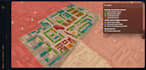
That includes land surface temperature analysis from Landsat or Sentinel imagery, heat island intensity mapping across your study area, and a 3D digital twin model that overlays temperature, land cover, and building footprints. For larger projects I add time-series comparisons across seasons or years and practical notes on where green space or reflective surfaces would help most.
Tools: Python, QGIS, Google Earth Engine, and 3D modeling software depending on the deliverable you need.
Send me your area of interest and what you plan to use the results for, such as a report, presentation, or planning tool, and I'll confirm scope before we start. It's delivered as a self-contained interactive dashboard you can explore live, not a static report.
Technology:
Jupyter Notebook
•
arcgis
•
Pandas
Analysis type:
Quantitative analysis
•
Impact analysis
Expertise:
Forecasting
•
Statistics
•
Time series analysis
Programming language:
Python
What data do you use for the heat island analysis?
Mainly free satellite imagery from Landsat and Sentinel, along with any local land cover or building data you can share to sharpen the digital twin.


