Browse categories
Explore
Fiverr Pro
English
$
USD


Welcome to my gig
Hi, I am a Tableau certified Business Intelligence (BI) professional, ready to create stunning and interactive Tableau dashboards tailored to your needs.
What I Offer:
Note:
If you have any questions or business needs, please contact me before placing your order.
Thank you. :)
Expert in Data Entry and Data Analytics
Languages
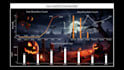
What is Tableau?
Tableau is a data visualization and business intelligence tool that helps users create interactive and shareable dashboards. It connects to various data sources, simplifies raw data into understandable visual formats like graphs, charts, maps, and more.
What are Dimensions and Measures in Tableau?
Dimensions are qualitative data that divide the data into different categories (e.g., names, dates, regions). Measures are quantitative data that are analyzed numerically (e.g., sales, profit).


