Browse categories
Explore
Fiverr Pro
English
$
USD

Power BI Specialist , End to End Data Analytics , SQL Pipelines
Skills
See my services

Data Analyst & Analytics Engineer
Self-Employed / Freelancer • Freelance
Jun 2026 - Present • 4 mos
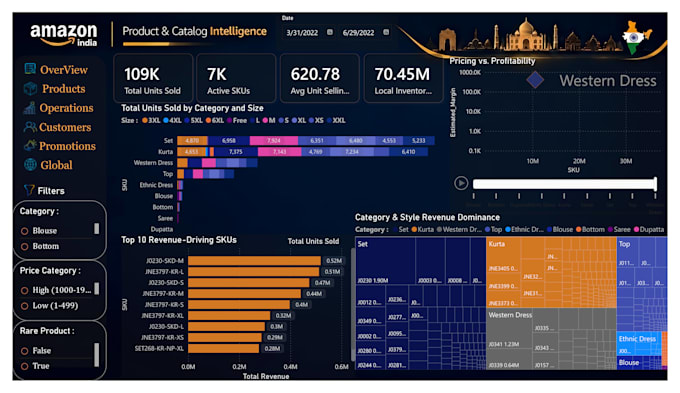
Designed interactive Power BI dashboards, built robust data models using DAX, and automated end-to-end data pipelines using Python and SQL for diverse business clients. My typical end-to-end analytics workflow covers four key stages: 1. Data Extraction, Cleaning & Transformation (Python & SQL): - Extracted and merged fragmented datasets from multiple databases, APIs, and Excel spreadsheets. - Cleaned messy records, handled missing values, resolved schema discrepancies, and removed duplicates using Python (Pandas) and SQL scripts, ensuring 100% data integrity without record loss. - Optimized Power Query workflows to prepare structured staging tables for seamless ingestion. 2. Relational Data Modeling & Advanced Calculations (DAX): - Designed normalized schemas and star-schema models to support high-performance reporting. - Authored custom, advanced DAX measures for complex business logic, including time intelligence (YoY, MoM growth), rolling averages, margin calculations, and dynamic KPI targets. 3. Executive Dashboard Architecture & UX Design (Power BI): - Built intuitive, interactive dashboards customized to match corporate visual identity and brand colors. - Implemented smart navigation, drill-through pages, bookmarks, and cross-filtering to provide both high-level executive summaries and deep operational breakdowns. - Automated report distribution and scheduled refreshes to replace repetitive manual reporting. 4. Actionable Business Insights & Decision Support: - Translated technical data metrics into clear operational insights, highlighting revenue drivers, cost leaks, and sales trends. - Empowered leadership and business owners to make confident, data-backed strategic decisions that improve profitability and operational efficiency.
