Browse categories
Explore
Fiverr Pro
English
$
USD
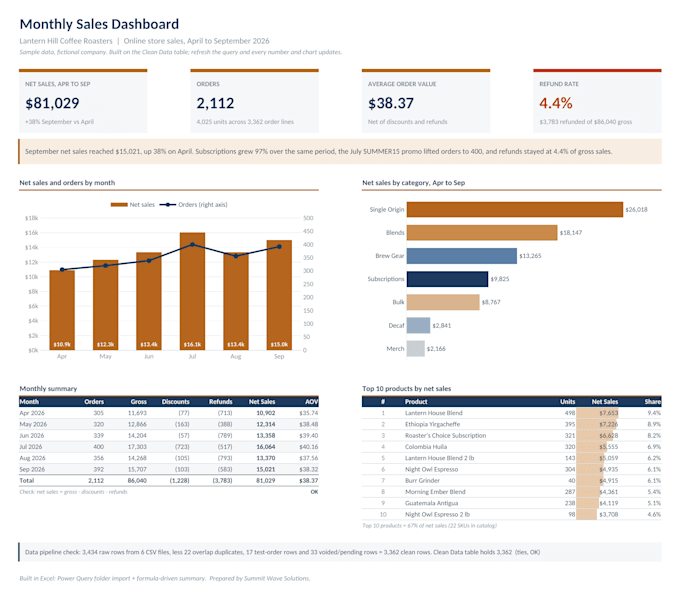
I turn the monthly report you rebuild by hand into one that updates itself in Excel. Drop next month's export in a folder, click Refresh, and your report is done.
How it works:
1. You send 2 or 3 recent exports.
2. I set up Power Query to combine and clean them, then build your report.
3. You get a finished Excel file and a short note on how to refresh it.
Pick the package that fits how you'll use it:
What is an export type?
One kind of file from one system with the same columns every time, such as Shopify orders or a QuickBooks sales report. More months of the same export don't count. Extra export types are $100 each.


Technology:
Excel
Expertise:
Data manipulation
•
ETL
•
Transformation
What cleanup is included?
Removing duplicates, test or voided orders, and blank rows, turning text dates into real dates, and fixing names or codes that change from month to month. The same steps run every time you hit Refresh.
Which Excel do I need?
Microsoft 365 or Excel 2016 and newer on Windows works best. Microsoft 365 on Mac also supports Power Query. Tell me which you use in the requirements and I'll build it to refresh on your setup.
What if my export changes later?
If your system renames or adds a column, the refresh may need a small fix. Message me and I'll tell you what it takes before any work starts.
What counts as a revision?
A revision is one round of changes to your finished report, such as swapping a chart type, renaming labels, or changing colors. Basic includes 1 revision, Standard 2, Advanced 3. Extra revisions are $40 each.