Browse categories
Explore
Fiverr Pro
English
$
USD

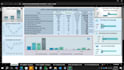
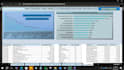
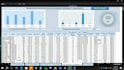
Are you looking for clean, professional, and interactive Excel dashboards to make smarter business decisions? I specialize in building Excel-based dashboards, charts, graphs, pivot tables, and reports that turn raw data into powerful, easy-to-understand visuals.
Whether it's for sales tracking, financial analysis, KPI monitoring, or operations, I design custom solutions tailored to your needs. My dashboards are not just visually appealing-they're interactive, automated, and optimized for performance.
Let's transform your data into clear, decision-driving visuals. Message me today and get started with a dashboard that delivers real results.
Languages


