Browse categories
Explore
Fiverr Pro
English
$
USD


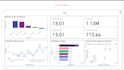
Transform Your Financial Data into Actionable Insights
Are you struggling to make sense of your business financials? I'll create stunning,
interactive dashboards that turn complex data into clear visualizations.
WHAT YOU'LL GET:
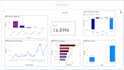
- Professional multi-page dashboards (Sales, Profitability, EBITDA, PAX Analysis)
- Interactive charts and KPI cards
- Time-based trend analysis
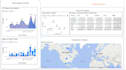
- Geographic sales mapping
- Product and segment performance tracking
- Discount impact analysis
- Custom metrics and calculations
- Mobile-responsive design
DASHBOARD FEATURES:
Sales overview with key metrics (Revenue, Profit, COGS, Margins)
Year-over-year comparisons
Profitability analysis by product/segment/country
EBITDA tracking and breakdowns
PAX (customer) analytics
Dynamic filtering and drill-down capabilities
Professional color schemes and branding
️ TOOLS I USE:
- Power BI
- Excel & SQL (data preparation)
- DAX & SQL for complex calculations
WHAT I NEED FROM YOU:
- Your data files (Excel, CSV, SQL database, or other formats)
- Business requirements and KPIs you want to track
- Colour preferences or brand guidelines (optional)
PERFECT FOR:
- Finance teams
- Business analysts
- C-level executives
Dashboards That Speak Your Business Language
Languages
Q: What file formats do you accept?
A: Excel, CSV, SQL databases, Google Sheets, and most common data formats.
Q: Will the dashboard be interactive?
A: Yes! All dashboards include filters, slicers, and drill-down capabilities
: Can you help if I don't have clean data?
A: Yes! I offer data cleaning and preparation services depends on cleaning it may take extra day


