I will build an interactive data visualization graph using d3 js and react

T
thembdev
T
thembdev
Mohammed B

Level 2

About this gig

Hello!

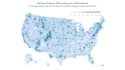
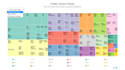
I will help you transform your raw data with high-performance, interactive data visualizations and user-centric web applications. My expertise lies in transforming complex data into clear, engaging visual stories using React and D3.js.


I have developed several charts using React+D3 JS and I'm here to help you build:

  • Bar charts
  • Scatter plots
  • Heat maps
  • Choropleth maps
  • TreeMap Diagrams
  • World map data viz


What to expect:

  • Well-designed and accurate data visualization charts
  • great performance and interactivity
  • clean well-structered code based on components
  • chart integration in your website


If you have any questions, feel free to contact me :)

Get to know Mohammed B

Mohammed B

Web Development Enthusiast!

5.0(64)

Level 2

  • FromMorocco
  • Member sinceApr 2022
  • Avg. response time1 hour
  • Last delivery2 months
  • Languages

    English, French, Japanese
Hello🙋🏻‍♂️! I'm Mohammed, a web developer who loves creating awesome websites and apps. I've worked on over 90 different projects for clients all over the world. I've built everything from big web apps and dashboards to simple landing pages and online stores. My commitment to quality is reflected in my consistent 5.0-star reviews. If you're looking for a reliable and skilled developer, let's connect! 🫱🏼‍🫲🏼

My Portfolio

Related tags