Browse categories
Explore
Fiverr Pro
English
$
USD


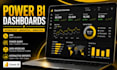
When your data is everywhere, the right dashboard changes everything.
Power BI should do more than display chartsit should expose what deserves attention. Your data will be shaped through Power Query, connected through a reliable model, strengthened with DAX measures, and brought to life with interactive visuals, slicers, drill throughs, and focused KPIs. Whether your source is Excel, CSV, SQL, or multiple tables, the goal is a report that feels effortless to navigate while revealing performance, movement, gaps, and key business signals at a glance. Strong logic underneath. Sharp intelligence on screen. Every visual earns its place.
What You'll Get:
Perfect For:
Bring the data. Ill turn it into the view your business has been missing.
Sharper Data Stronger Business
Languages
I already have a dashboard. Can you improve or rebuild it?
Yes. Existing Power BI reports can be refined, restructured, or rebuilt where the current model, calculations, or presentation need improvement.
My data is messy. Is that a problem?
Not necessarily. The data can be assessed first to determine what needs cleaning, restructuring, or transformation before reporting.
Can you work from a specific dashboard design I have in mind?
Yes. A reference, sketch, screenshot, or existing report can be used to understand the desired layout, navigation, and visual direction.
Can you match my business KPIs and reporting logic?
Yes. Your required metrics and calculation rules can be incorporated so the report reflects how your business actually measures performance.
What if my project involves several Excel files or tables?
That is workable. Multiple sources can be combined where their structure and relationships support a reliable Power BI model.
Can you make the report easy for my team to use?
Yes. Navigation, filtering, page structure, and interactive elements can be organized around the way your users need to explore the information.
Can you explain the finished report after delivery?
Yes. The completed dashboard can be accompanied by guidance on its key pages, functionality, calculations, and intended use.
Can you work with confidential business data?
Yes. Only the information necessary to complete the agreed project should be provided, and sensitive details can be removed or anonymized where practical.
