Browse categories
Explore
Fiverr Pro
English
$
USD
I am a data analyst
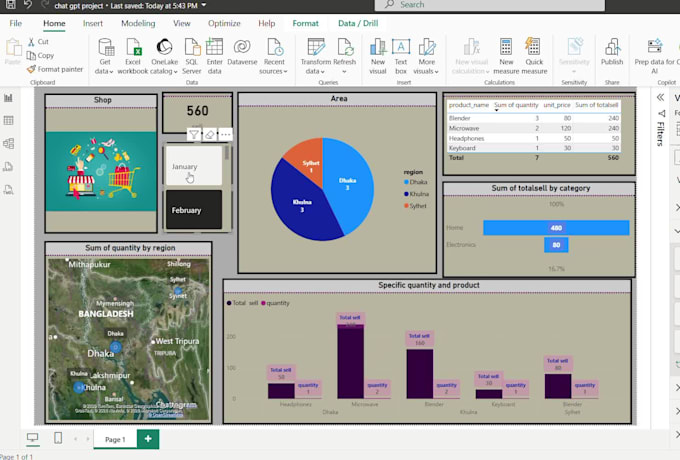
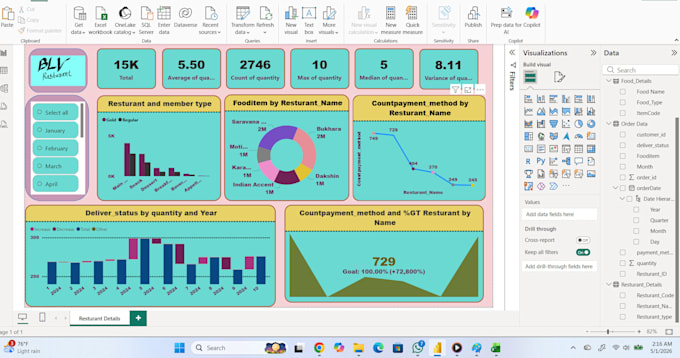
Looking for a professional Power BI developer to turn messy data into clear, impactful dashboards? You're in the right place.
I specialize in Power BI, DAX, SQL, PostgreSQL, Excel, and Power Query helping businesses make data-driven decisions through clean, interactive visualizations.
What I Offer:
Power BI Dashboard Design
Revenue & Financial Analysis
KPI Tracking, Trends & Slicers
Data Cleaning & Transformation (Power Query/ETL)
DAX Measures & Calculated Columns
Profitability & ROI Dashboards
Business Reports
Data Sources I Work With:
Excel, CSV, Google Sheets, PostgreSQL, PDF, and more
Industries I Serve:
Healthcare, Marketing, Finance, SaaS, Operations, E-commerce, Sales & Retail
Why Work With Me:
- Proficient in SQL, PostgreSQL, Power BI & Excel
- Strong background in data analytics
- Experience building real business intelligence dashboards
- Clear communication and on-time delivery
Let's turn your data into a dashboard that drives decisions!

Why me?
Because I have proper knowledge as a data nalyst
What do you require from me in order to begin the project?
I need your project specifications, the KPIs you wish to monitor, your preferred dashboard style, and your data source (Excel, CSV, SQL database, Google Sheets, etc.).
Are you able to make unique DAX calculations and measures?
Of course. I am able to create advanced business metrics, YTD/MTD computations, calculated columns, KPIs, and custom DAX measures.
How much time will it take to finish my project?
Project complexity, data quality, and requirements all affect delivery time. While complicated BI solutions could take more time, simple dashboards can be delivered quickly.
Can unstructured or untidy data be used to generate dashboards?
Before building dashboards, I am able to use Power Query and data modeling approaches to clean, transform, and model messy data.
Will there be interaction on my dashboard?
Every dashboard has tooltips, drill-through pages, slicers, interactive filters, and dynamic visualizations where appropriate.