Browse categories
Explore
Fiverr Pro
English
$
USD


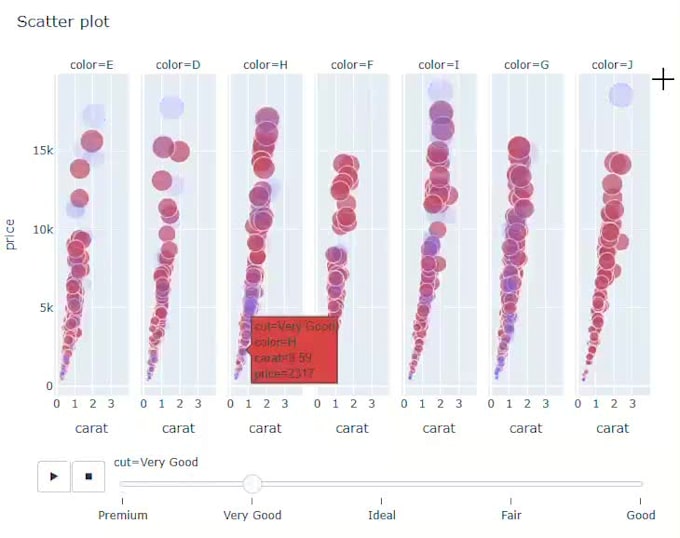
I will clean and visualize your data using Python (pandas, matplotlib, seaborn, plotly), Power BI, and Excel. Whether you need clear charts, interactive dashboards, or detailed insights, I deliver high-quality visuals tailored to your needs. Suitable for business reports, presentations, and data analysis projects.
Clean, Analyze, and Visualize Your Data in One Solution
Languages
Q1: What data formats do you accept?
A: I accept Excel, CSV, JSON, and SQL databases. Please provide clean or semi-clean data for best results.
Q2: Can you clean messy or raw data?
A: Yes! Advanced data cleaning is included in the Premium package. For basic cleaning, please choose the Standard package.
Q3: What tools do you use?
A: I use Python libraries (pandas, matplotlib, seaborn, plotly), Power BI, and Excel depending on the project.
Q4: Do you provide interactive dashboards?
A: Interactive dashboards are included in the Standard and Premium packages using PowerBI
Q5: Do you include animated visuals?
A: Yes, animated and interactive visuals are included in the Premium package.
Q6: Which package includes the Plotly library?
A: The Plotly library is used in the Premium package for advanced interactive visualizations.