Browse categories
Explore
Fiverr Pro
English
$
USD

See your sales results clearly in one practical Excel dashboard.
I will customise a dashboard from one clean Excel or CSV file for one business and one currency.
Every package includes:
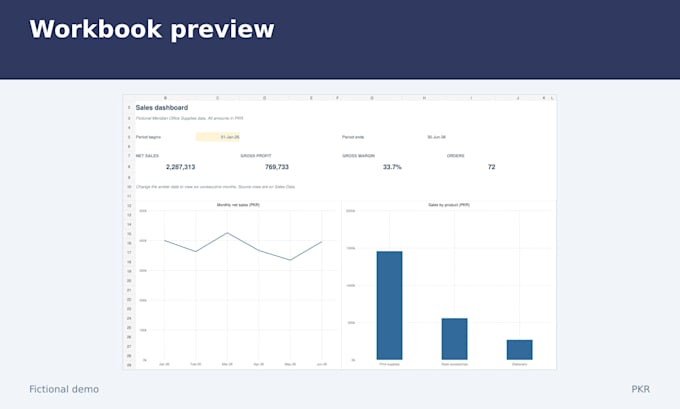
- Net sales, gross profit, gross margin and order count
- A monthly sales line chart and sales by product group bar chart
- Six consecutive months and up to three product groups
- An editable data sheet, visible formulas and brief instructions
- Your business name and preferred colours
Choose by the number of clean sales records to load:
Basic: up to 200 records, delivered in 3 days
Standard: up to 350 records, delivered in 4 days
Premium: up to 500 records, delivered in 5 days
Each package includes one revision within the agreed scope. The workbook has 500 prepared data rows. Charts update when you edit data within those rows or change the starting month.
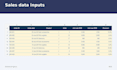
Supply one row per order with a unique order ID, date, product group, units, sale price, unit cost and discount. Cost data is needed for profit calculations.
Message me before ordering if your data needs cleaning or your reporting needs differ.
Excel Dashboards, Invoice Trackers and Travel Costing
Languages
What data do I need to provide?
Provide one clean Excel or CSV file with one row per order: unique order ID, date, product group, units, unit sale price, unit cost and discount percentage. Use 0 where no discount applies. The standard layout covers one currency and up to three product groups.
What if I do not have cost data?
Unit cost data is needed to calculate gross profit and gross margin. I will not invent missing costs. Contact me before ordering to agree on a suitable scope. Gross profit excludes operating expenses and taxes.
Which charts are included?
Every package includes two charts: monthly net sales as a line chart and sales by product group as a bar chart. The reporting window covers six consecutive months and up to three product groups. Other charts or reporting structures need a separate agreement.
Can I update the dashboard after delivery?
Yes. Edit the data within the 500 prepared rows or change the starting month, and the formulas and charts recalculate in Excel. The package limits refer to initial data loading. Expansion beyond 500 rows, live connections and automatic imports are outside this scope.
Which software is this for?
This service is for Microsoft Excel. You will receive an editable .xlsx workbook with visible formulas and instructions. Please provide your Excel version. Google Sheets conversion, Power BI dashboards, VBA macros and slicers are outside these packages.
What does one revision cover?
One revision is one round of adjustments within the agreed scope, such as colours, chart labels or formatting. Additional records, charts, product groups, data cleaning or a different dashboard structure require a separate agreement.