Browse categories
Explore
Fiverr Pro
English
$
USD
I will perform Exploratory Data Analysis (EDA) and data visualization using Python with Pandas, NumPy, Matplotlib and Seaborn.
I can help you understand your data, identify important patterns and trends, and present the findings through clear and professional visualizations.
What I can do for you:
Data loading and initial data inspection
Data cleaning and preprocessing
Missing-value analysis and handling
Duplicate and irrelevant-column removal
Data type conversion
Exploratory Data Analysis (EDA)
Statistical analysis
GroupBy and aggregation analysis
Customer and sales analysis
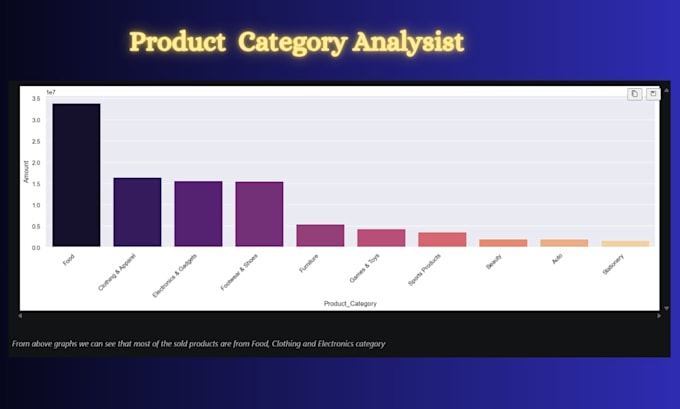
Data visualization using Matplotlib and Seaborn
Identification of trends and patterns
Business-oriented insights and conclusions
Clean and well-organized Python/Jupyter Notebook
Tools I use:
Python
Pandas
NumPy
Matplotlib
Seaborn
Jupyter Notebook
What you will receive:
Cleaned and analyzed dataset
Python/Jupyter Notebook
EDA and analysis results
Professional visualizations
Key findings and insights
Easy-to-understand analysis
I focus on creating clean, understandable and meaningful analysis rather than simply generating charts.
Please contact me before placing an order.
THANK YOU


Technology:
Jupyter Notebook
Analysis type:
Exploratory analysis
Expertise:
Business Insights
•
Statistics
Programming language:
Python
What type of datasets can you analyze?
I can work with common structured datasets such as CSV and Excel files. Please contact me if you have a different format.
Which Python libraries do you use?
I primarily use Pandas, NumPy, Matplotlib and Seaborn for data analysis and visualization.