Browse categories
Explore
Fiverr Pro
English
$
USD


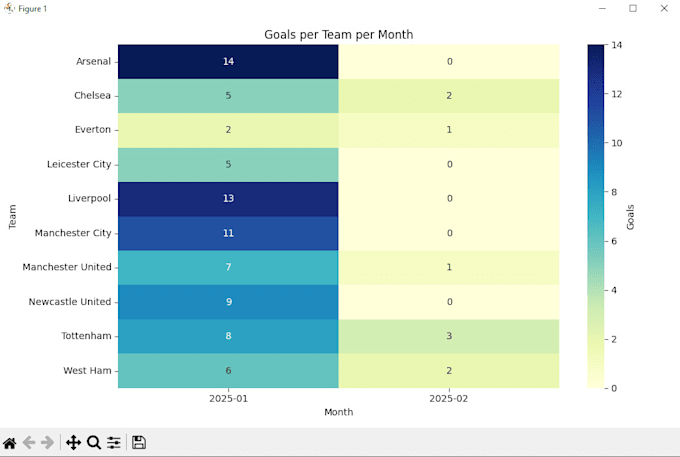
I will create interactive Python dashboards and data visualizations to help you understand and analyze your data. Using Pandas, Matplotlib, Seaborn, and Tkinter, I can transform raw CSV or Excel datasets into meaningful insights and professional charts. My services include line charts, bar plots, pie charts, heatmaps, and interactive dashboards tailored to your business or project needs.
Whether you need a sales analysis, performance metrics, or a custom data visualization, I provide well-structured, clean Python code with comments for easy understanding and reproducibility. I focus on making complex datasets simple and visually appealing, allowing you to track trends, identify top performers, and make data-driven decisions efficiently.
I also offer customizations to match your specific requirements, including color schemes, chart types, and dashboard layouts. Every project is delivered with a professional approach, actionable insights, and a focus on clarity and usability. Perfect for businesses, analysts, or anyone looking to visualize data in a meaningful way.
Languages
What types of data can you work with?
I can work with CSV, Excel, and other structured datasets. Your data can be from sales, sports, finance, or any domain.
What kind of visualizations can you create?
I provide line charts, bar charts, pie charts, heatmaps, and interactive dashboards using Matplotlib, Seaborn, and Tkinter. Custom chart types can also be implemented.
Will I receive the Python code?
Absolutely. Every project comes with clean, well-documented Python code so you can reproduce, modify, or extend it.
Can you customize charts and dashboards?
Yes, I can customize colors, layouts, chart types, and metrics according to your specific needs.
What is your delivery format?
You will receive Python files (.py or .ipynb), the processed dataset, and screenshots of visualizations. Interactive dashboards are fully runnable.