Browse categories
Explore
Fiverr Pro
English
$
USD





Turn your Excel data into a clear, professional and interactive business dashboard.
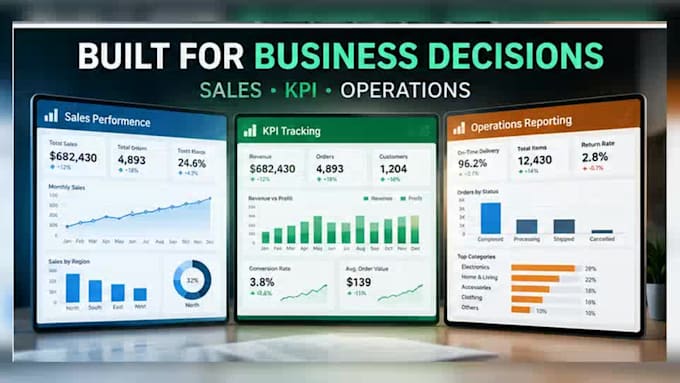
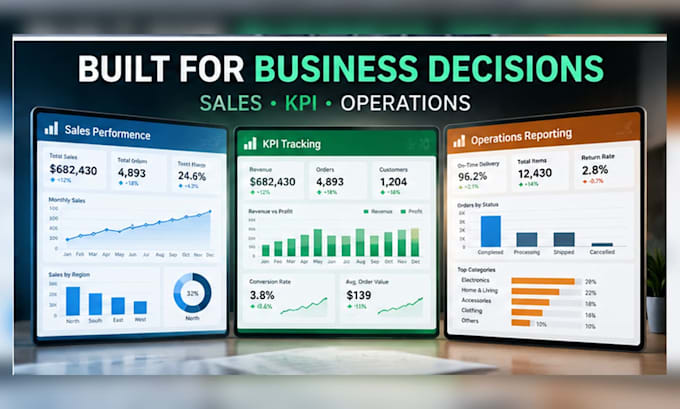
I will create a customized Excel dashboard that helps you monitor KPIs, identify trends, compare performance and make better business decisions.
What I can create:
KPI and management dashboards
Sales and performance reports
Interactive charts, slicers and filters
PivotTables and dynamic reporting
Monthly, weekly and yearly comparisons
Business and operational analysis
Data cleaning and preparation
Power Query automation for advanced packages
I focus on practical dashboards that are easy to understand, professional to present and simple to update with new data.
Suitable for sales, operations, retail, restaurants, finance, projects and other business reporting needs.
You will receive an editable Excel file tailored to your requirements.
Please message me before ordering if your project involves complex datasets, multiple data sources, VBA/macros, advanced automation or special requirements.
Senior Operations Executive
Languages
Should I contact you before placing an order?
Yes, especially for complex dashboards, multiple data sources, Power Query, VBA/macros or automation. Please send me a sample of your data and requirements so I can confirm the scope and recommend the right package.
What do you need from me to start?
Please provide your Excel or CSV data, the KPIs you want to track, any preferred charts or layout, and a brief description of how you currently use the report. Sample files or screenshots are also helpful.
Can you work with messy or unstructured data?
Yes. I can clean, organize and structure your raw Excel or CSV data before building the dashboard. Data cleaning may require an extra service depending on the size and complexity of the dataset.
Can the dashboard be updated with new data later?
Yes. I can build the dashboard so new data can be added and refreshed. For more advanced automated refresh workflows, Power Query can also be included depending on your package or requirements.
Do you provide VBA, macros or advanced automation?
Yes, for suitable projects. VBA, macros and advanced automation are not included in every package, so please contact me before ordering and I will review your requirements and provide a custom offer if needed.
Will I receive an editable Excel file?
Yes. You will receive the editable Excel workbook used for your dashboard. The file will be designed so you can review and update the data after delivery.