I will do data visualization using tableau and powerbi

W
wyckliff
W
wyckliff
Dr. W. Herberts

About this gig

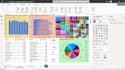
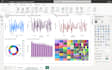
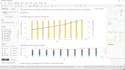
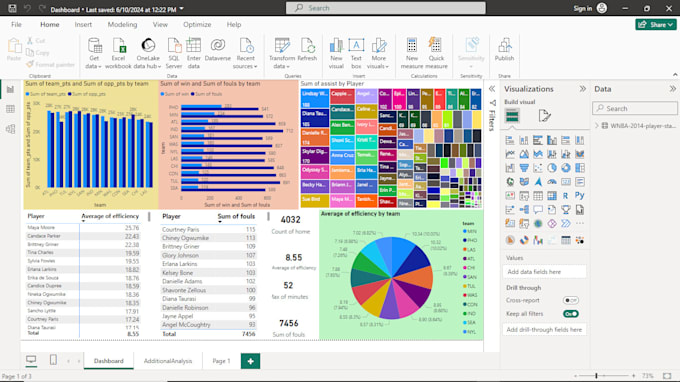
Data visualization using Tableau and Power BI, to display sheets, stories, and dashboards. The visuals include line charts, bar charts, histograms, maps, tree diagrams, pie charts, and many more visuals available in Tableau and Power BI

Get to know Dr. W. Herberts

Dr. W. Herberts

Engineering design, FEA, CFD using SolidWorks, ANSYS, Inventor Pro

4.3(1)
  • FromKenya
  • Member sinceApr 2020
  • Avg. response time1 hour
  • Last delivery1 month
  • Languages

    English
I am an Industrial engineer with design skills in Inventor Pro, SolidWorks, and ANSYS Workbench. I can perform conceptual design and FEA & CFD tasks and complete them efficiently. I have 7 years' technical experience in engineering research and design. Also, I can use a wide range of statistical tools to conduct data analysis. The software I can use include SPSS, EViews, JASP, JMP, STATA, Power BI, Ms Excel, and Tableau. I can handle project scheduling and resource allocation tasks: Gantt, WBS, Critical Path using MS Project, Project Libre, and flow charts using Ms Visio and Draw.io

My Portfolio