Browse categories
Explore
Fiverr Pro
English
$
USD
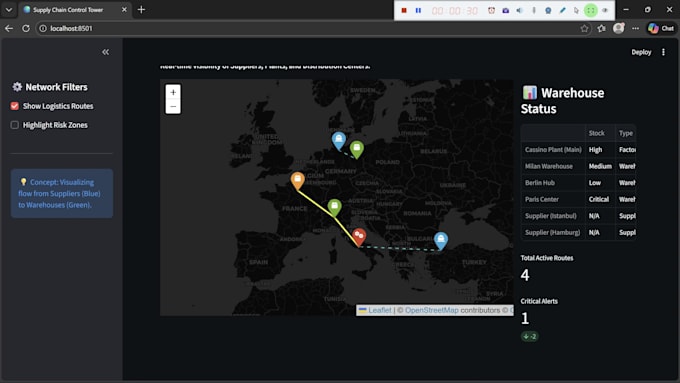
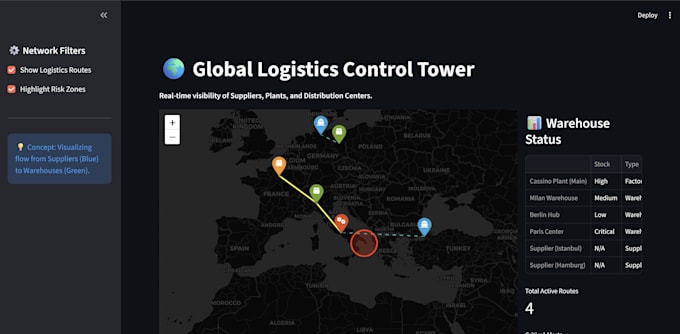
Are you managing your supply chain with outdated spreadsheets? It's time to visualize your network.
I am an Industrial Engineer specialized in Python & Data Visualization. I will build an interactive "Supply Chain Control Tower" or "Digital Twin" map for your business.
What you will get:
Interactive Map: Visualize Suppliers, Plants, and Distribution Centers (DCs) globally.
Risk Monitoring: Highlight disruption zones (e.g., weather, delays) on the map.
Inventory Status: Color-coded markers showing stock levels (Critical/Healthy).
Route Visualization: Clear lines showing flow of materials and products.
Tech Stack:
* Python (Pandas, NumPy)
* Streamlit (Web App)
* Folium (Geospatial Mapping)
Why me?
Unlike standard developers, I understand Industrial Engineering concepts (Safety Stock, Lead Time, Network Design). I build tools that solve real logistics problems.
Please message me before ordering to discuss your network data.
Is my company's supply chain data confidential?
Absolutely. I treat all data with strict confidentiality. I am happy to sign an NDA (Non-Disclosure Agreement) before we start. Your data is used ONLY for this project and will be deleted immediately after delivery.
What kind of data do I need to provide?
A simple Excel or CSV file is enough. I need columns for: Location Name, Coordinates (Latitude/Longitude), and Type (Factory/Warehouse). If you have inventory data or flow volumes, include those too. I can provide a template if needed.
Do I need to install Python to run the dashboard?
No! I will provide a web link (Streamlit Cloud) or a standalone HTML file that runs in any browser. If you want to run the Source Code internally, I will provide a requirements.txt file for easy installation.
What is the difference between the "Static Map" and "Interactive Dashboard"?
The Static Map (Basic) is just a high-quality image or HTML file for reports. The Interactive Dashboard (Standard/Premium) is a live web app where you can zoom, filter routes, click on warehouses to see details, and simulate scenarios.
Can you customize the "Risk Alerts" for my specific business?
Yes. Since I code everything in Python (not using rigid software), I can define custom logic. For example: "If stock < 500 units, turn the icon RED" or "If lead time > 10 days, show a Warning."