Browse categories
Explore
Fiverr Pro
English
$
USD
Data Analyst
Are you looking for professional geospatial data visualization or interactive maps? You're in the right place.
I am a Geophysics Engineering graduate specializing in geospatial data analysis and visualization using Python (Folium, Plotly, GeoPandas) and QGIS.
What I offer:
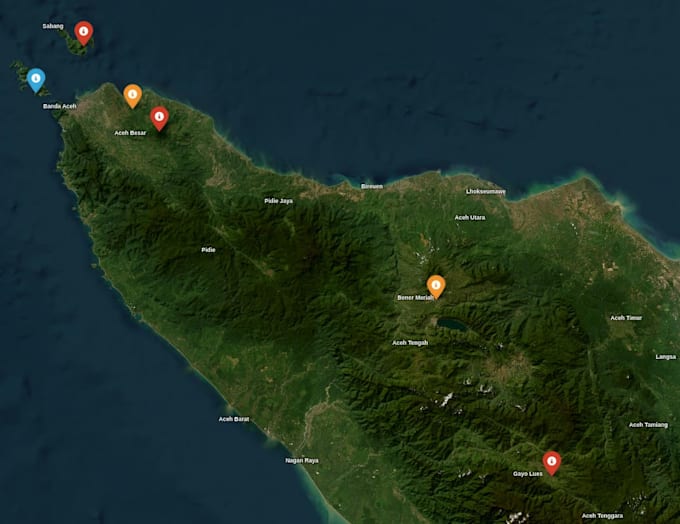
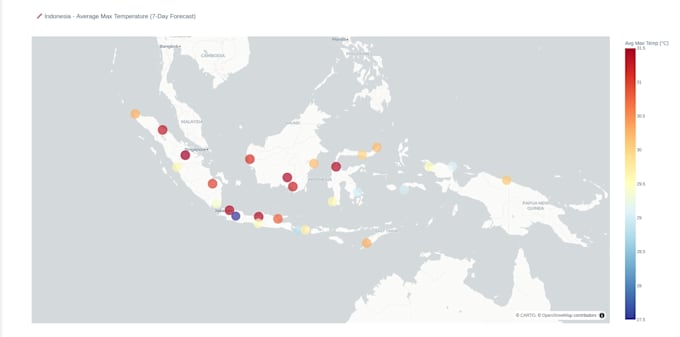
Interactive maps (choropleth, heatmap, point map)
Geospatial data visualization
Data analysis and dashboard creation
Technical report with charts and maps
Output in HTML, PNG, or PDF format
Why choose me:
⭐ Fast delivery
⭐ Clear communication
⭐ Revision until you're satisfied
⭐ Real project experience in oil & gas industry
Feel free to contact me before ordering to discuss your needs!

What format will the output be delivered in?
I deliver outputs in HTML (interactive), PNG, or PDF format depending on your needs.
Do you need my data to start?
Yes, please share your dataset before ordering so I can confirm it's suitable for the visualization you need.