Browse categories
Explore
Fiverr Pro
English
$
USD
Microsoft Certified Data Engineer, Power BI, Data Automation Expert
Level 1
Has met certain performance criteria and shows strong potential in the marketplace.
Highly Responsive
Known for exceptionally quick replies
Drowning in spreadsheets? Can't see what your data means? Your stakeholders demand insights you can't deliver fast enough.
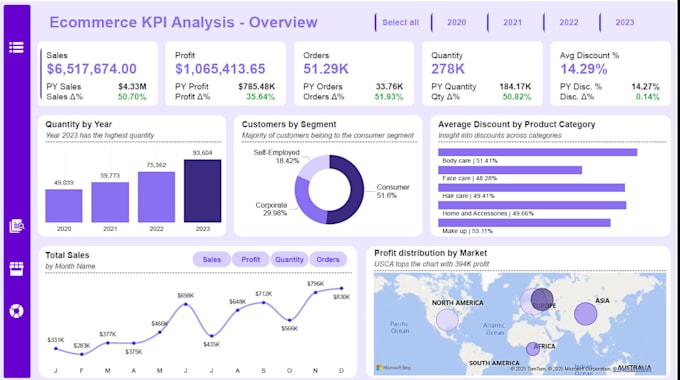
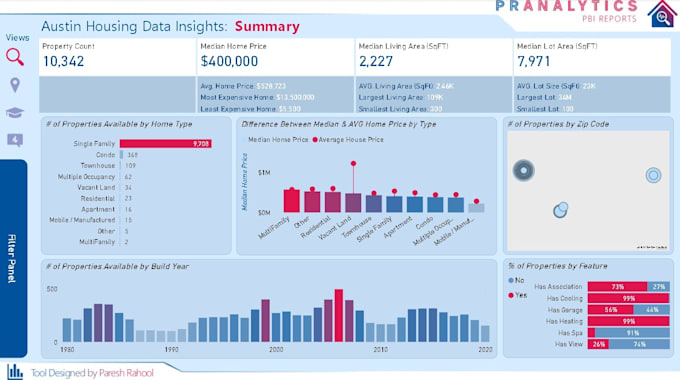
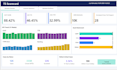
I fix this. I build interactive Power BI, Tableau, and Looker dashboards that turn chaos into clarity. With 4x Microsoft certifications, 200+ enterprise clients, and 400+ dashboards delivered, I know exactly how to transform your raw data into strategic dashboards your team will actually use.
What I Deliver: Complete end-to-end BI solution. I clean and model your data, design intuitive layouts, write advanced formulas, add interactive filters and drill-downs, optimize performance, and provide 30 days of support. Your dashboard connects to live data and updates automatically.
Why Me: I work with HBL, Western Union, Engro Energy, Pakistan State Oil. I don't just design dashboardsI engineer them for scale. Every calculation is optimized. Every interaction is intentional.
Result: Faster decisions. Reduced reporting time. Clear visibility into what matters.
Ready? Message me with your data and business goals. I'll assess scope and provide a timeline within 2 hours.
Keyword: Power BI Dashboard , Tableau Dashboard , Looker Dashboard, Power BI Expert


Q1: What is included in your dashboard service?
Everything needed for a production-ready dashboard. I start with data assessment and cleaning, create data models with proper relationships, design the dashboard layout following BI best practices, write custom formulas and calculations, add interactive elements like filters and drill-through, optim
Can you scrape and extract data from websites automatically?
Yes. I build automated web scraping scripts using Python with BeautifulSoup and Selenium to extract data from any website. The scraped data is then cleaned, structured and loaded directly into your Power BI, Tableau or Qlik dashboard for reporting and analysis.
I cannot share my real data due to confidentiality. Can you still help?
Absolutely. You can share a dummy dataset with the same structure and I will complete the full analysis and dashboard. I also offer secure remote sessions via AnyDesk or TeamViewer where I work directly on your screen and your data never leaves your system.
Can you build both a dashboard and a detailed analysis report together?
Yes. I deliver both an interactive dashboard for visual exploration and a structured data analysis report with clear business insights, trends and KPI recommendations so you get the complete picture of your data.
Do you write DAX formulas and advanced calculations?
Yes. I write advanced DAX expressions for Power BI including KPIs, running totals, year over year comparisons and custom business calculations. For Tableau I use calculated fields and for Qlik I use set analysis and aggr functions.
Can you handle large datasets with millions of rows?
Yes. I have analyzed trillion data at enterprise level for banking and energy sector and Oil & gas clients using SQL, Python, Qlik SENSE and Power BI. Large datasets and complex data models are my specialty.
Do you provide revisions?
Yes, I offer revisions to ensure your complete satisfaction. My goal is to deliver a professional, accurate, and visually appealing Power BI dashboard.
Can you redesign or improve an existing Power BI, Qlik or Tableau dashboard?
Yes! If you already have a dashboard that needs improvement in design, performance, or calculations, I can redesign and optimize it for better usability and insights.
Which tools do you work with?
I specialize in Power BI, Tableau, and Looker. Each tool has strengths. I recommend based on your business needs. Power BI excels with Microsoft ecosystems. Tableau is best for complex visualizations. Looker integrates with Google and enterprise data warehouses. Tell me your preference and I'll buil