 August 3, 2026
 8 minute reading
Organizations across every industry now rely on visual analytics to make faster, smarter decisions. As data volumes grow and business intelligence becomes mission-critical, the demand for skilled professionals who can transform raw data into interactive dashboards has surged throughout 2026. Companies need experts who understand both the technical side of Tableau development and the strategic value of clear data storytelling.
Understanding what you'll pay for this expertise depends on several variables, including project complexity, deliverable type, developer experience, and engagement model. This guide breaks down current marketplace pricing based on real Fiverr data, explains what influences cost at each level, and helps you determine which service structure aligns best with your goals and budget.
Average Tableau Developer Costs
Based on recent Fiverr marketplace data, Tableau development services show considerable price variation depending on the type of deliverable and scope of work. Fixed-price projects for basic data analysis and simple visualizations start as low as $25, while comprehensive data visualization projects average around $179.
Dashboard development, the most requested Tableau service on Fiverr, averages $143 for fixed-price projects and spans $7 to $100 per hour. This average blends everything from single-page starter dashboards to more advanced multi-source builds. Related visualization work varies by deliverable: creating standalone graphs and charts typically costs around $75 fixed-price, with hourly rates between $15 and $50. Geographic information systems (GIS) work, often built using Tableau's mapping features, averages $126 fixed price with hourly rates from $15 to $35. Report creation sits at an average of $99 fixed price, with hourly rates between $25 and $125.
Consultation services provide strategic guidance without full implementation. Data analytics consultation averages $101 fixed price with hourly rates from $40 to $60, while data visualization consultation runs approximately $107 fixed with hourly rates spanning $40 to $300 for senior advisors.
Which Pricing Model Is Best for You?
Freelancers typically offer two engagement models. Fixed-price works best when your deliverable is clearly scoped to things like dashboard creation, report templates, or visualization requests where requirements are well understood, since you pay an agreed amount regardless of time invested. Hourly billing suits exploratory work, ongoing optimization, or projects with evolving requirements, such as consultation engagements or iterative dashboard improvements, but requires more active project management to keep costs predictable.

What Influences Tableau Development Pricing
Project Complexity and Data Source Integration
Simple dashboards connecting to a single CSV file or Excel workbook typically take 3 to 5 hours and cost between $75 and $150. These projects involve basic chart types, limited interactivity, and straightforward data preparation. Mid-complexity projects connecting to SQL databases, cloud data warehouses, or multiple data sources usually require 10 to 20 hours of work and range from $300 to $800. These include calculated fields, parameters, custom filters, and moderate data blending.
Advanced implementations integrating real-time APIs, complex data models, embedded analytics, or custom extensions can take 40 hours or more and cost $1,500 to $4,000. These projects demand deeper technical skills, including SQL optimization, API authentication, performance tuning, and often collaboration with your data engineering team.
Dashboard Interactivity and User Experience Design
Basic static dashboards with standard chart types and minimal interaction cost significantly less than highly interactive applications. Adding features like drill-down capability, dynamic parameters, cross-dashboard actions, and custom tooltips increases development time by 30 to 50 percent. Projects requiring mobile-responsive design, accessibility compliance, or brand-specific styling add another 20 to 40 percent to baseline costs.
When user experience becomes central to the project, expect pricing to reflect the additional design iteration. Dashboards intended for executive presentations require different treatment than operational monitoring tools, and this specialization affects both timeline and cost.
Data Preparation and Transformation Requirements
If your data arrives clean, structured, and analysis-ready, development costs stay lower. However, most real-world projects require significant data preparation. Light data cleaning and basic transformations add 2 to 5 hours to a project. Moderate ETL work, including joining multiple tables, handling missing values, creating derived metrics, and addressing data quality issues, can add 10 to 15 hours.
Complex data pipelines requiring advanced transformations, deduplication logic, historical trend calculations, or integration with data preparation tools like Tableau Prep can double project timelines and costs. Understanding your data readiness before engaging a developer helps set realistic budget expectations.
Ongoing Maintenance and Update Needs
One-time dashboard creation differs substantially from ongoing support arrangements. Initial development may cost $500 to $1,500, but monthly maintenance retainers for updates, new visualizations, and performance optimization typically run $200 to $800 per month depending on frequency and scope of changes. Businesses with evolving KPIs or regular reporting updates should budget for continued support rather than treating visualization as a one-time expense.
Tableau-Specific Concepts That Affect Pricing
Several Tableau-specific decisions shape both scope and long-term cost, beyond the general complexity factors above.
- Tableau Public vs. private workbooks: Tableau Public is a free tier for publishing dashboards openly on the web, often used for portfolios or public-facing reports. It has no licensing cost but doesn't support private data or business-sensitive dashboards, which require Tableau Server or Tableau Cloud instead.
- Tableau Cloud vs. Tableau Server: Tableau Cloud is Tableau's fully hosted, subscription-based option, while Tableau Server is self-hosted on your own infrastructure. Cloud reduces upfront IT overhead but comes with ongoing subscription costs; Server shifts costs toward infrastructure and in-house maintenance. This decision affects which hidden costs (see below) apply to your project.
- Creator, Explorer, and Viewer roles: Tableau's licensing tiers determine who can build dashboards (Creator), interact with and lightly edit them (Explorer), or only view them (Viewer). Projects involving multiple builders require more Creator licenses, which is typically the largest ongoing cost beyond development itself.
- Live connections vs. Extracts: Live connections query your data source directly and stay current in real time, but can require more performance tuning and ongoing data source management. Extracts pull a snapshot of data into Tableau, which is faster to work with but needs a refresh schedule. This choice affects both development approach and maintenance needs.
- Published Data Sources: Centralizing a data source so multiple dashboards can reuse it reduces duplicated setup work across future projects, which can lower the cost of building additional dashboards later.
- Performance Recorder: A built-in Tableau tool for diagnosing slow dashboards. Developers use it during performance optimization work (see Hidden Expenses below) to pinpoint bottlenecks before recommending fixes.
- Tableau Prep Builder: Tableau's dedicated data preparation tool, used for cleaning, joining, and reshaping data before it reaches a dashboard. Projects relying on Prep for complex transformations generally fall into the moderate-to-complex data preparation range described above.
Cost Breakdown by Project Type
Understanding what you get at different price points helps align your budget with realistic outcomes. Here's how Tableau development services typically break down across experience and scope levels.
Basic Dashboard Development ($75 to $300)
- Single-page dashboard with 3 to 6 standard visualizations
- Connection to one or two simple data sources like Excel or CSV files
- Basic filtering and minimal interactivity
- Standard chart types such as bar charts, line graphs, and pie charts
- Delivery within 2 to 5 business days
- Best for small businesses, startups, or teams testing Tableau for the first time
Intermediate Analytics Solutions ($300 to $1,200)
- Multi-page dashboards with 8 to 15 visualizations
- Integration with databases, cloud platforms, or multiple data sources
- Calculated fields, parameters, and moderate interactivity
- Custom formatting aligned with brand guidelines
- Basic data preparation and quality checks included
- Delivery within 1 to 2 weeks
- Best for growing companies needing regular business intelligence reporting
Advanced Enterprise Implementations ($1,200 to $5,000+)
- Complex multi-dashboard applications with 20+ interconnected visualizations
- Real-time data connections and API integrations
- Advanced calculations, LOD expressions, and table calculations
- Embedded analytics, custom extensions, or Tableau Server deployment support
- Comprehensive data modeling and optimization for large datasets
- Full documentation and knowledge transfer
- Delivery within 3 to 6 weeks depending on scope
- Best for enterprises with sophisticated analytics needs and large user bases
Consultation and Strategy Services ($100 to $600)
- Dashboard audit and optimization recommendations
- Data visualization best practices guidance
- Architecture planning for Tableau deployments
- Training sessions for internal teams
- Performance tuning and troubleshooting existing workbooks
- Typically delivered as hourly sessions or fixed-scope assessments
- Best for organizations with in-house teams needing expert guidance
Related Services and Their Impact on Overall Costs










.jpg)
















Vetted Pro
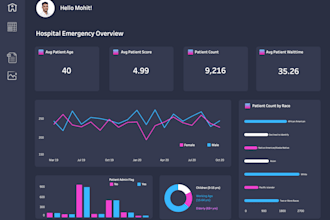
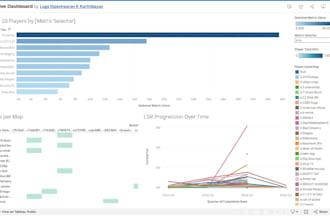
I will be your dedicated power bi tableau looker studio dashboard developer
Offers video consultations



































Vetted Pro
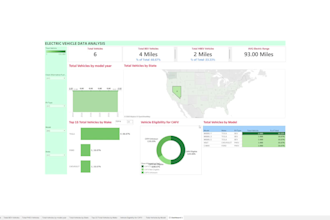
I will create interactive visualization and dashboard in tableau
Offers video consultations

Level 2
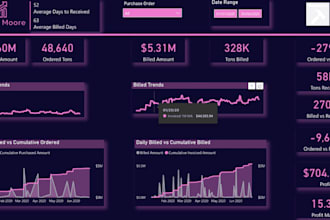
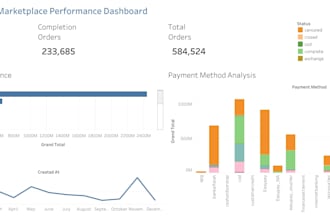
I will design impactful tableau reports with meaningful metrics
Offers video consultations
Data Analytics Consultation
Before building dashboards, many businesses benefit from consultation on Tableau-specific architecture decisions — whether to use Tableau Cloud or Server, how many Creator vs. Viewer licenses they'll need, and how to structure published data sources so future dashboards can reuse them. Consultation typically runs $40 to $60 per hour or around $100 for fixed-scope sessions. Getting these decisions right upfront often reduces rework later, since switching licensing tiers or data source structures after development is underway typically costs more than planning for them from the start.
Data Visualization Design
Separate from technical Tableau development, visualization design focuses on how information is presented within Tableau's dashboard and story format — layout across containers, color palettes, and visual hierarchy planned before development begins. This service ranges from $75 to $200 depending on the number of views and complexity. Getting this right in Tableau specifically matters because restructuring a dashboard's container layout after development is further along tends to require more rework than adjusting a design mockup upfront.
Custom Report Development
Beyond interactive dashboards, many organizations need scheduled reports, PDF exports, or formatted presentations generated from their data. Report development services create automated reporting workflows, often integrated with email distribution or collaboration platforms. These projects typically cost $99 to $190 depending on automation requirements and formatting complexity. When combined with dashboard creation, comprehensive reporting solutions provide both real-time exploration and regular distribution of insights.
Data Preparation and Tableau Prep Services
Many Tableau projects stall because data isn't ready for analysis. Data preparation services clean, transform, join, and structure data before visualization begins — commonly using Tableau Prep Builder, though some developers also work with Python scripts or SQL queries depending on the project. Pricing varies widely based on data volume and complexity, ranging from $100 to $500 for straightforward preparation work. Addressing data quality early, ideally within Tableau Prep's workflow, prevents downstream issues when dashboards are built on top of it.
Tableau Training and Enablement
For organizations building internal Tableau capabilities, training services teach teams to create and maintain their own dashboards. Training can be delivered as live sessions, recorded tutorials, or written documentation. Hourly rates for training range from $50 to $150, while comprehensive training programs may cost $500 to $2,000. This investment helps teams get more value out of Creator licenses they're already paying for, rather than routing every dashboard change through an external developer.
Ongoing Costs and Hidden Expenses
Beyond the initial development investment, several recurring and unexpected costs can affect your total analytics budget.
- Tableau Software Licensing: Tableau Creator licenses cost approximately $70 per user per month, while Viewer licenses run around $12 to $15 monthly. Your licensing needs depend on how many people will build versus consume dashboards. This represents one of the largest ongoing expenses for organizations maintaining Tableau environments.
- Data Source Subscription Costs: If your dashboards connect to premium data sources, APIs, or third-party services, expect monthly subscription fees ranging from $20 to several hundred dollars depending on data volume and provider pricing.
- Maintenance and Updates: Dashboards require periodic updates as business requirements change, data sources evolve, or Tableau versions update. Budget $150 to $500 monthly for active dashboard maintenance, or $50 to $200 per update for occasional changes.
- Server Hosting and Infrastructure: Organizations using Tableau Server or Tableau Online face hosting costs. Cloud hosting through Tableau Online starts around $42 per user monthly, while self-hosted Tableau Server requires infrastructure investment and IT support ranging from $200 to $2,000 monthly depending on scale.
- Performance Optimization: As data volumes grow, dashboards may slow down and require optimization work. Performance tuning projects typically cost $200 to $800 depending on workbook complexity and data architecture challenges.
- Additional Data Integration: Adding new data sources, APIs, or databases to existing dashboards after initial development typically costs $100 to $400 per new connection depending on complexity and authentication requirements.
Frequently Asked Questions
How much does Tableau development cost on Fiverr?
Tableau development on Fiverr spans a wide pricing spectrum based on deliverable type and complexity. Entry-level services like basic data analysis and simple visualizations start around $21 to $75, suitable for small projects or businesses exploring data visualization capabilities for the first time. Mid-tier services including dashboard creation, business intelligence analytics, and custom reporting range from $100 to $180, representing the most common price point for typical business needs. Premium services featuring complex multi-dashboard applications, real-time integrations, advanced analytics, and enterprise implementations can exceed $200 and often involve hourly arrangements for larger scopes. Many professionals also offer related services like consultation, training, and ongoing optimization that can be bundled based on your specific requirements.
What are typical hourly rates for Tableau developers?
Hourly rates for Tableau developers on Fiverr vary significantly based on expertise and service type. Entry-level developers handling basic tasks charge $7 to $25 per hour, suitable for simple data connections and straightforward visualizations. Mid-level professionals with solid experience in dashboard design and moderate complexity projects typically charge $40 to $80 per hour. Senior developers and specialists commanding rates from $100 to $300 per hour bring advanced skills in data architecture, complex calculations, embedded analytics, and enterprise deployment.
What is typically included in a basic Tableau dashboard package?
A basic Tableau dashboard package usually includes a single-page dashboard with three to six standard visualizations connected to one simple data source like an Excel file or CSV. You can expect basic interactivity such as simple filters, standard chart types including bar charts, line graphs, and tables, and delivery of the completed Tableau workbook file. Most basic packages include one or two rounds of revisions to adjust visuals or formatting based on your feedback. The developer typically handles basic data preparation if your source data is relatively clean and structured. However, basic packages generally do not include advanced features like complex calculated fields, multi-source data blending, custom design work, mobile optimization, or ongoing maintenance. Upgrades to include additional pages, more sophisticated interactivity, connections to databases or APIs, custom branding, training, or documentation typically cost extra. Understanding these boundaries helps set appropriate expectations and budget for expansions as your analytics needs grow beyond initial implementations.

Related Guides



About the author
Yaron HarushData Team Leader
Yaron Harush is an Analytics Team Lead at Fiverr with over six years of experience in product analytics within a large-scale marketplace. He has a strong background in hands-on data analysis, experimentation, and building analytical foundations, with deep expertise in SQL and business-driven product analytics. His career reflects a progression from individual contributor roles to leading and mentoring a team of analysts in close partnership with product teams.
